Dr. Ahmad Shahzad
Founder | Lyallpur Diabetes Foundation
Consultant Diabetologist | Educator | Advocate for Preventive Care
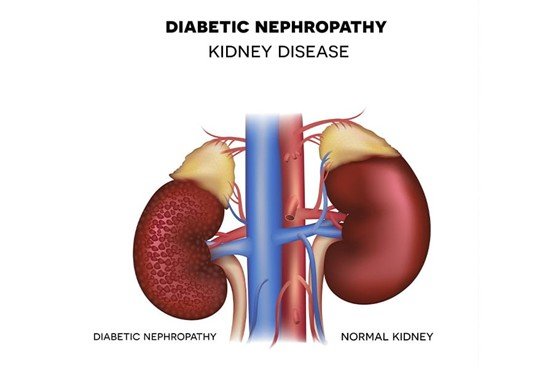
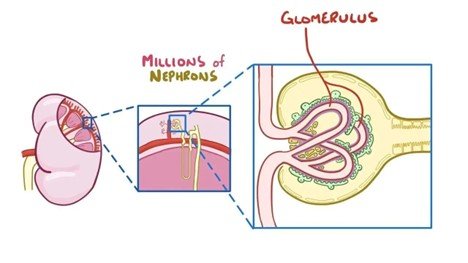
Diabetic nephropathy is one of the most serious complications of diabetes and is a leading cause of chronic kidney disease worldwide. Understanding the pathophysiology of diabetic nephropathy is crucial, as it reveals the complex biological processes that drive kidney damage in people with diabetes. It starts with early dysfunction of the glomeruli because of long-term hyperglycemia and slowly develops into structural dysfunction of the basement membrane, mesangial cells, and podocytes. Such changes gradually culminate into proteinuria, decreased kidney performance, and later onset of end-stage renal disease. Understanding the underlying mechanisms, researchers and clinicians can find more strategies to detect, prevent, and treat it early.
Early Pathophysiological Changes
Diabetic nephropathy is initiated by unique hemodynamic changes, metabolic distress, and molecular damage, all of which play a role in early glomerular injury.
1. Hemodynamic Alterations and Hyperfiltration
Glomerular hyperfiltration, or an abnormally high glomerular filtration rate (GFR), is one of the earliest nephropathy signs of diabetes. This is because the afferent arteriole dilates, and the efferent arteriole constricts cause an increase in intraglomerular pressure and increased filtration rate at the single-nephron level.
Such vascular tone imbalance is caused by several vasoactive factors such as angiotensin II, nitric oxide, prostaglandins, VEGF, and TGF-B and poor autoregulation through tubuloglomerular feedback (TGF).
Recent studies have proposed that in addition to impaired TGF, acute hyperglycemia itself can activate afferent arteriolar dilation via a Piezo1 eNOS signaling pathway, further complicating the mechanisms driving hyperfiltration.
2. Metabolic Stress: Hyperglycemia, AGEs, and Oxidative Stress
Persistent hyperglycemia triggers multiple pathways that contribute to early renal injury:
- Advanced Glycation Endproducts (AGEs): 1. Nonenzymatic glycation of proteins and lipids results in AGEs that may accumulate in the glomerular basement membrane (GBM), mesangium, and vascular endothelium. Connection with receptors of AGEs (RAGE) facilitates oxidative stress, pro-inflammatory, and profibrotic growth factor.
- Mesangial Cell Response: High glucose enhances mesangial cell hypertrophy and matrix expansion, which drives GBM thickening and structural glomerular damage.
- Oxidative Stress and Signaling Pathways: Protein kinase C (PKC) and growth factors (TGF-b and VEGF) are activated by metabolic derangements, which contributes to the further tissue injury.
3. Endothelial and Podocyte Injury
Hyperglycemia not only stresses glomerular blood flow but also damages the cellular components of the filtration barrier:
Glomerular Endothelial Cells (GECs): High glucose provokes endothelial dysfunction associated with glycocalyx loss, mitochondrial oxidative stress, endothelin-1 release, and decreased nitric oxide supply – all of which disrupt vascular integrity and increase inflammatory and fibrotic responses.
· Podocytes: These epithelial cells are very delicate to metabolic stress. Hyperglycemia induces podocyte apoptosis, foot-process afflation and epithelial-mesenchymal transition (EMT), which cause loss of filtration components of nephrin and podocin.
Molecular and Biochemical Mechanisms
Diabetic nephropathy is a complex of molecular and biochemical mechanisms that enhance the destruction of the kidney. These processes include activation of RAAS, oxidative stress, advanced glycation, growth factor signaling as well as inflammatory pathways.
1. Activation of RAAS & Oxidative Stress
The renin-angiotensin-aldosterone system (RAAS), more particularly the elevated angiotensin II (Ang II), is central to the etiology of kidney disease. Ang II binding to the AT 1 receptor activates downstream cascades through both G-protein-dependent (e.g. PLC->DAG->PKC) and non-G-protein signaling, leading to NAD(P)H oxidase and increased production of reactive oxygen species (ROS).
This oxidative condition encourages expression of pro-inflammatory transcription factors such as NF-KB, increase growth factors such as TGF-b and ECM accumulation which result in renal injury and proteinuria.
2. Advanced Glycation End Products (AGEs) & RAGE
Continued hyperglycemia results in AGEs, which bind to the receptor of AGEs (RAGE) that is abundantly expressed in kidney cells, including mesangial cells and podocytes. This interaction induces ROS and PKC and NF-KB, and activates fibrotic pathways such as TGF-3 and VEGF, promoting inflammation, damage to filtration barrier, and fibrosis.
3. TGF-β Signaling: The Fibrosis Driver
TGF-b1 is a focal mediator of renal fibrosis in diabetic nephropathy. It works through canonical Smad-dependent and non-Smad pathways to stimulate ECM deposition, and to prevent degradation.
- Smad-mediated: TGF-b interacts with its receptor complex and activates Smad2/3 that translocate to the nucleus (with Smad4) to control the expression of fibrotic genes.
- Non-Smad pathways TGF- replies through ERK, p38 MAPK, and PI3K/AKT signaling that strengthen fibrotic responses.
TGF-β promotes fibrosis through:
- Enhanced ECM production (e.g., collagen, fibronectin),
- ECM stabilization via lysyl oxidase and crosslinking enzymes,
- Suppressed ECM degradation, by upregulating PAI-1 and TIMPs while downregulating MMPs.
4. Oxidative Stress & MAPK Pathways
Hyperglycemia-induced ROS also stimulates inflammatory processes, ECM deposition, and cell growth in the kidney via mitogen-activated protein kinases (MAPKs), especially, p38 MAPK and JNK.
TGF-b is also enhanced by ROS via AP-1 activation, establishing the vicious circle of oxidative stress and fibrogenesis.
5. Cytokines, JAK/STAT, and Inflammatory Cascades
NF-KB is activated and leads to increased levels of TGF-B and inflammatory cytokines such as TNF-alpha and IL-6. Also, JAK2/STAT3 signaling axis reacts to hyperglycemic stress by elevating apoptosis and fibrosis of renal cells by promoting proinflammatory and ROS-mediated mechanisms.
6. VEGF, CTGF & Growth Factors
High glucose and Ang II also activate VEGF-A and CTGF among other growth factors that induce further mesangial proliferation, deposition of ECM, and podocyte apoptosis. Although VEGF appears to regulate TGF-b in some cases, in diabetic nephropathy VEGF overexpression enhances glomerulosclerosis and fibrosis.
Summary Table
| Mechanism | Key Role in Diabetic Nephropathy |
| RAAS & Oxidative Stress | Ang II-driven ROS → inflammation, fibrosis, proteinuria |
| AGEs & RAGE | Hyperglycemia-induced inflammation, ROS, PKC, NF-κB activation |
| TGF-β Signaling | Core driver of fibrosis via ECM synthesis and inhibition of degradation |
| MAPK Pathways (e.g., p38) | Stress response leading to ECM deposition, proliferation |
| NF-κB & JAK/STAT Pathways | Mediating inflammation, apoptosis, fibrotic progression |
| Growth Factors (VEGF, CTGF) | Promote podocyte injury and ECM expansion |
Progressive Kidney Damage
With progression of diabetic nephropathy, the combined effects of glomerular damage, proteinuria, and tubular damage combined to lead to permanent damage of the kidneys. The period between early symptomatic dysfunction of the kidney, which may be silent, and the open expression of kidney dysfunction is this phase that makes a transition into end-stage kidney disease (ESKD).
1. From Microalbuminuria to Proteinuria and Renal Decline
There is usually a clear clinical course. Microalbuminuria, faint evidence of early nephropathy, frequently occurs in patients after an average of 10 years of diabetes. In type 1 diabetes, nearly 80 percent of patients with persistent microalbuminuria develop overt proteinuria (macroalbuminuria) within 5-7 years.
The glomerular machinery starts to decline faster once the proteinuria appears. Glomerulosclerosis—diffuse or nodular—becomes evident on biopsy, alongside arteriolar hyalinosis and tubulointerstitial fibrosis. The glomerular filtration rate (GFR) starts to decrease at a steady rate- on average 0.5 to 1.0 mL/min per month in untreated patients.
With the accumulation of nephron loss, serum creatinine can be falsely kept in the normal range, until much of the filtration capacity has already been impaired.
2. Glomerulosclerosis and Nephron Loss
Damage of the glomeruli increases the rate of loss of filtering units. Mesangial expansion decreases surface area to be filtered, which directly correlates with GFR declines.
Diffuse and nodular glomerulosclerosis with the classic Kimmelstiel-Wilson lesions continues to impair filtration capacity, introducing a massive loss of nephrons.
3. Tubulointerstitial Fibrosis and Tubular Atrophy
It is not only the glomerulus that is affected by injury. Proteinuria itself—especially large amounts of filtered protein—acts as a pro-inflammatory and profibrotic catalyst in the tubular compartment. Excessive protein in tubular epithelial cells triggers NF-KB activation, release of chemokines and cytokines, and macrophage recruitment, which promotes interstitial inflammation and fibrosis.
In addition, changes induced by hyperglycemia, such as increased SGLT2 activity, local angiotensin II, TGF-b1, and CTGF in tubules, initiate tubular hypertrophy, oxidative stress, apoptosis, and matrix deposition-all drivers of tubulointerstitial fibrosis.
It has been confirmed that in some instances tubular dysfunction may predate or precede through the urinary-based biomarkers, including kidney injury molecule-1 and N-acetyl-B-D-glucosaminidase.
4. Encroachment and Global Sclerosis
Pathology is also expressed structurally: Bowman capsule injury reaches adjacent tubules, causing tubular atrophy and subsequent global sclerosis. With the cessation of glomerular filtration, tubules degenerate, losing epithelial architecture and being replaced by fibrotic interstitium.
5. Final Common Pathway: ESRD
Advanced diabetic nephropathy culminates in chronic kidney disease and eventually ESKD—requiring dialysis or transplantation. This terminal phase is characterized by the interaction between structural damage, ongoing proteinuria, glomerulosclerosis, tubulointerstitial fibrosis, and nephron loss.
You may also like to read: Diabetes Mellitus and Kidney
Clinical Correlation with Pathophysiology
To diagnose, risk stratify, and intervene with diabetic nephropathy, an understanding of the clinical manifestation of the condition in relation to its underlying pathophysiology is imperative.
Clinical Stages and Diagnostic Markers
Stage 1 – Hyperfiltration (“Hyperfunction”)
- Pathophysiology: Glomerular hyperfiltration through the action of afferent dilatation and efferent constriction, RAAS activation, and greater glomerular pressure.
- Clinical Correlate: Swollen kidneys, and increased GFR- usually not noticeable.
- Significance: Marks functional change before gross damage–and can be reversed by glycemic and pressure control.
Stage 2 – Silent Structural Damage
· Pathophysiology: The histological alterations of GBM thickening and mesangial enlargement start, but without albuminuria.
· Clinical Correlate: GFR can return to normal or be elevated; routine clinical analysis can still be normal.
Stage 3 – Microalbuminuria (Incipient Nephropathy)
- Pathophysiology: Trace albumin leakage is enabled by podocyte and GBM permeability alterations.
- Clinical Correlate: Urine albumin excretion increases to 30300 mg/day (microalbuminuria), which can only be identified through sensitive tests such as ACR. May be associated with increased blood pressure.
- Impact: Microalbuminuria is a predictor of the development of overt proteinuria and increased cardiovascular risk.
Stage 4 – Overt Nephropathy (Macroalbuminuria)
- Pathophysiology: Glomerulosclerosis and advanced loss of podocytes result in high protein leakage.
- Clinical Correlate: Urinary albumin excretion exceeds 300 mg/day (macroalbuminuria) and the blood pressure persists with deteriorating GFR.
- Progression: In the untreated, GFR decreases gradually (e.g. 1.2 mL/min/month in Type 1 DM) and then speeds up to ESRD.
Stage 5 – End-Stage Renal Disease (ESRD)
- Pathophysiology: Irreversible nephron loss from advanced glomerular and tubular fibrosis.
- Clinical Correlate: GFR is less than 15 mL/min/1.73 m 2 resulting in overt kidney failure that necessitates dialysis or transplantation.
Diagnostic and Prognostic Utilities of GFR & Albuminuria
Current clinical practice (e.g., KDIGO) classifies chronic kidney disease in terms of GFR (G1-G5) and albuminuria (A1-A3). This two-fold coding enhances risk evaluation and guides monitoring rate and treatment.
G1–G2 with A1: Early disease—low risk.
Increase in ACR (A2 and higher) and/or decrease in eGFR: Signs of progression and increases cardiovascular and renal risks.
Remarkably, GFR can decrease without extensive albuminuria in some patients, notably with the RAAS blockade-so both the markers are important.
Final Thoughts
The pathophysiology of diabetic nephropathy involves a cascade of early functional disturbances, structural alterations, and complex molecular mechanisms that ultimately lead to progressive kidney damage. By linking these pathological changes with clinical outcomes, it becomes clear why early detection and intervention are critical. A deeper understanding of these processes not only aids in better disease management but also paves the way for developing targeted therapies to slow or prevent the progression of this serious complication of diabetes.